Frontend Performance Optimization Guide
Table of Contents
- Key Concepts
- Best Practices
- LCP Optimization Solutions
- Case Study
- The Blocking Nature of CSS and JS
- CSS Asynchronization and Extraction
- Reports
Key Concepts
90th Percentile
The 90th percentile refers to a value in a dataset where 90% of the data is less than or equal to that value. In the field of performance optimization, the 90th percentile is often used to measure core user experience metrics, such as page load time, interaction response time, etc. It provides a more comprehensive reflection of the actual experience of most users, rather than just focusing on the average.
TTFB and FCP
- TTFB (Time to First Byte): The time from when a user initiates a request to when the first byte is received.
- FCP (First Contentful Paint): The time when the browser first renders any content (text, images, etc.).
- TTI: Time to Interactive, needs to exclude back/forward cache scenarios.
- Can be identified via
PerformanceNavigationTiming’stype: back_forward.
- Can be identified via
if (domNodeReady()) {
  performance.mark('self-tti');
  performance.measure('tti', 'fetchStart', 'self-tti');
  var measures = performance.getEntriesByName('tti')[0];
}
Optimization Goals
- Keep the time difference between TTFB and FCP within 2000ms.
- Above-the-fold styles should be inlined, while other non-critical CSS/JS should be placed at the bottom of the
<body>(JS before CSS), or userel="preload"to load non-blocking resources:<link rel="preload" as="style" href="styles.css" onload="this.rel='stylesheet'">
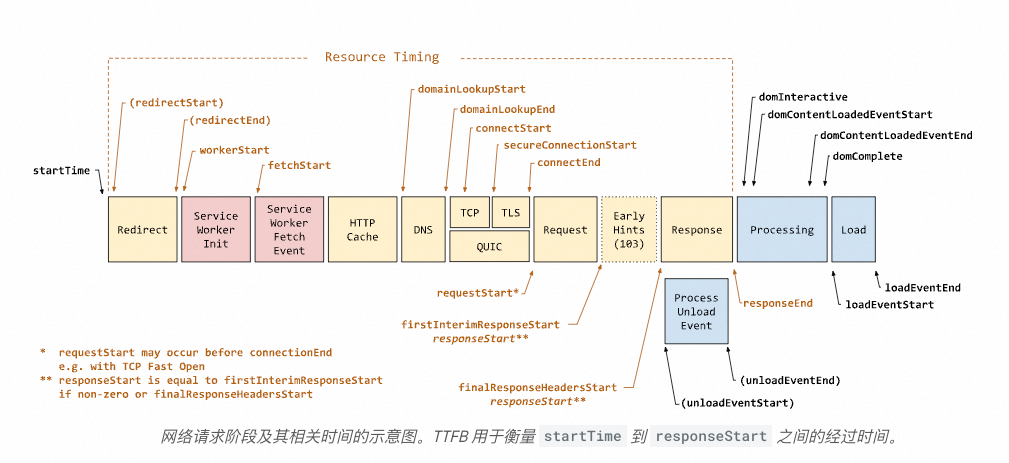 navigationStart (Overall page navigation begins)
|
|—————-| redirectStart (Optional)
|—————-| redirectEnd (Optional)
|———————| serviceWorkerInit (Service worker initialization)
|—————————| serviceWorkerFetchEvent (Service worker handles fetch event)
|———————| fetchStart (Check cache/request resource)
|————————–| httpCacheCheck (HTTP cache check)
|—————————-| domainLookupStart (DNS lookup starts)
|—————————-| domainLookupEnd (DNS lookup ends)
|—————————-| connectStart (TCP connection establishment starts)
|—————————-| secureConnectionStart (HTTPS handshake starts, if SSL/TLS)
|—————————-| connectEnd (Connection completes)
|—————————–| earlyHint (103 status code)
|—————————–| requestStart (Request is sent)
|———————————-| responseStart (First byte of response received - TTFB)
|——————————————| responseEnd (Full response received - Content Download complete)
|———————| jsLoadStart (JavaScript file loading starts)
|—————————–| jsLoadEnd (JavaScript file loading ends)
|———————| cssLoadStart (CSS file loading starts)
|—————————–| cssLoadEnd (CSS file loading ends)
|———————| imgLoadStart (Image loading starts)
|—————————–| imgLoadEnd (Image loading ends)
|———————————————–| domLoading (Starts parsing the HTML document)
|—————————————————| domInteractive (Document parsing is complete)
|————————————————————| domContentLoadedEventStart (DOM construction is complete)
|————————————————————| domContentLoadedEventEnd (Document is ready)
|——————————————————————-| domComplete (DOM is complete)
|———————————————————————-| renderingPhaseStart (Rendering phase starts)
|————————————————————————–| loadEventStart (Page loading starts)
|————————————————————————-| loadEventEnd (Page loading is complete)
– Resource Timing (RT) for each resource can be calculated using these points:
[startTime]———————[httpCacheCheck]————-[responseEnd] -> (Resource RT)
navigationStart (Overall page navigation begins)
|
|—————-| redirectStart (Optional)
|—————-| redirectEnd (Optional)
|———————| serviceWorkerInit (Service worker initialization)
|—————————| serviceWorkerFetchEvent (Service worker handles fetch event)
|———————| fetchStart (Check cache/request resource)
|————————–| httpCacheCheck (HTTP cache check)
|—————————-| domainLookupStart (DNS lookup starts)
|—————————-| domainLookupEnd (DNS lookup ends)
|—————————-| connectStart (TCP connection establishment starts)
|—————————-| secureConnectionStart (HTTPS handshake starts, if SSL/TLS)
|—————————-| connectEnd (Connection completes)
|—————————–| earlyHint (103 status code)
|—————————–| requestStart (Request is sent)
|———————————-| responseStart (First byte of response received - TTFB)
|——————————————| responseEnd (Full response received - Content Download complete)
|———————| jsLoadStart (JavaScript file loading starts)
|—————————–| jsLoadEnd (JavaScript file loading ends)
|———————| cssLoadStart (CSS file loading starts)
|—————————–| cssLoadEnd (CSS file loading ends)
|———————| imgLoadStart (Image loading starts)
|—————————–| imgLoadEnd (Image loading ends)
|———————————————–| domLoading (Starts parsing the HTML document)
|—————————————————| domInteractive (Document parsing is complete)
|————————————————————| domContentLoadedEventStart (DOM construction is complete)
|————————————————————| domContentLoadedEventEnd (Document is ready)
|——————————————————————-| domComplete (DOM is complete)
|———————————————————————-| renderingPhaseStart (Rendering phase starts)
|————————————————————————–| loadEventStart (Page loading starts)
|————————————————————————-| loadEventEnd (Page loading is complete)
– Resource Timing (RT) for each resource can be calculated using these points:
[startTime]———————[httpCacheCheck]————-[responseEnd] -> (Resource RT)
Notes
- Place 5KB of critical CSS styles in the
<head>, but be careful to avoid it being too large and slowing down FCP (e.g., adding 800ms).
CLS, LCP, and Performance Metrics
- CLS (Cumulative Layout Shift): Measures the stability of the page layout.
- LCP (Largest Contentful Paint): Measures the loading speed of the main content of the page.
import { onLCP, onINP, onCLS, CLSMetric } from "web-vitals/attribution";
onLCP(val => {
  const customLog = ({
    type,
    c1,
    c2,
    c3,
    ...rest
  }: {
    type: string;
    c1: string | number;
    c2?: string;
    c3?: string;
    rest?: any;
  }) => {
    customSendEvent(type, { et: "OTHER", xpath: "", c1, c2, c3, ...rest });
  };
  customLog({
    type: 'LCP',
    c1: val
  })
})
Relationship
- CLS has a greater impact on a Good URL than LCP, because a stable layout directly affects user experience.
Best Practices
Above-the-Fold Style Optimization
- Inline Critical Styles: Inline the critical CSS required for the first screen into the HTML to ensure fast rendering.
- Asynchronously Load Non-Critical Styles: Place other styles at the bottom of the
<body>, or usepreloadfor non-blocking loading:<link rel="preload" as="style" href="non-critical.css" onload="this.rel='stylesheet'">
HTML Compression and the 14KB Rule
- 14KB Rule: The content of the first screen should be kept within 14KB (after compression) to ensure that the maximum data volume of the first round trip does not exceed the limit.
- Reason: The initial congestion window of the TCP protocol is usually 10 TCP packets, and each packet is about 1.4KB, totaling about 14KB.
On-Demand Loading
By reasonably choosing on-demand loading or SSR output, you can effectively improve the loading speed and user experience of the homepage.
- Large Packages: If a package is large (like
moment), loading it directly will significantly increase the homepage loading time. - Non-Core Features: For non-core functional modules on the homepage, you can choose on-demand loading to reduce the initial loading burden.
- Dynamic Content: Content that depends on user interaction (such as pop-ups, charts) is suitable for on-demand loading.
ssr
SSR (Server-Side Rendering) is a server-side rendering technology used to generate HTML on the server and return it directly to the client.
- Fast First Screen Load: The server directly returns complete HTML, reducing the client’s rendering time.
- SEO Friendly: Search engines can directly crawl the HTML content generated by the server.
- Small-Sized Resources: For small-sized resources, direct SSR output can avoid additional network requests. Generally, it can reduce about 150ms.
LCP Optimization Solutions
- Base64 Images: Convert the largest few images to Base64 encoding to avoid additional download requests.
- Preload Images: Use
preloadto load critical images in advance:<link rel="preload" as="image" href="large-image.jpg"> - Reduce HTML Size: Reduce page size by compressing HTML and reducing inline styles.
- React Hydration Optimization:
- Ensure elements are consistent before and after hydration to avoid changes to the LCP element.
- Avoid pop-ups or other dynamic components causing the LCP element to be deleted.
- Carousel Component Optimization: Avoid carousel components frequently deleting DOM elements, which affects LCP calculation. Why is msite’s LCP better than PC? Because msite has a back/forward function that directly uses the cache.
Case Study
Image Loading Jitter Issue
Problem Description
Jitter occurs after images are loaded because the loading of font files causes changes in text height, which in turn affects the image layout.
Solution
- Use Slow 3G to simulate the network environment and observe the impact of font loading on text height.
- Optimize the font loading strategy to avoid height changes caused by font switching.
The Blocking Nature of CSS and JS
- CSS Render Blocking: CSS files block the rendering of the page until all styles are loaded.
- JS Parsing Blocking: Non-asynchronous JS files block HTML parsing until the script is executed.
Optimization Suggestions
- Mark non-critical JS files as
asyncordeferto avoid blocking HTML parsing. - Use
preloadto load critical resources in advance.
CSS Asynchronization and Extraction
CSS Asynchronization
Achieve asynchronous loading of CSS in the following way:
<link rel="preload" as="style" href="styles.css" onload="this.rel='stylesheet'">
CSS Extraction Tools
- Use tools to extract critical CSS:
References
CSR and SSR Architecture
CSR architecture: Adopts separation of dynamic and static content. The static part is cached, and the dynamic part is requested via CSR. There are two forms of CSR requests. One is a two-stage request, first requesting the page structure frame (i.e., HTML), and then the components request specific data. A typical application of this is the merchant workbench, which uses this architecture. The detail page uses in-memory cache based on the product ID, so the API is very fast. However, the homepage cannot do this because its structure changes with the operations platform. SSR architecture: HTML is cached by a serviceworker, but the page structure, product, and operational data will be refreshed.
How to Get Resource Loading Duration with Performance API
performance.getEntriesByType("resource") returns an array of PerformanceResourceTiming objects. Each object contains detailed information about a single resource load.
name: The URL of the resource.startTime: The start time of the resource request (relative tonavigationStart).responseEnd: The time when the browser finishes receiving the resource’s response (all data is downloaded). This is usually the end time you need.duration: The total time to load the resource (equalsresponseEnd - startTime).fetchStart: The time the browser starts to fetch the resource (before DNS lookup).domainLookupStart: The start time of the DNS lookup.domainLookupEnd: The end time of the DNS lookup.connectStart: The start time of the TCP connection.connectEnd: The completion time of the TCP connection.requestStart: The time the browser sends the request.responseStart: The time the browser receives the first byte.secureConnectionStart: If it’s an HTTPS connection, the start time of the TLS handshake.let timing = performance.getEntriesByType('navigation')[0]Modern browsers recommend usingPerformanceNavigationTimingto get page load performance data because it provides more precise and detailed timing information. Older browsers usePerformanceTiming.
Getting Different Metric Data
import { onLCP, onINP, onCLS, CLSMetric } from "web-vitals/attribution";
Math.random() < 10 / 100 // 10% sampling rate
1. Prefetch
Purpose:prefetch is used to load resources during browser idle time, with minimal impact on the current page’s performance. It is suitable for pre-fetching resources for the next page and storing them in the browser cache.
Characteristics:
- By default,
prefetchrequests do not carry cookies. - The
credentialsattribute can be used to make the request carry cookies. Example Code:
<link rel="prefetch" href="next-page.js" as="script" credentials="include">
Dynamically Setting Cache Time: You can dynamically set the cache time of a resource on the server to control its validity period.
app.get('/next-page', (req, res) => {
  const header = req.headers['purpose'] || req.headers['sec-purpose'];
  if (header === 'prefetch') {
    res.set('Cache-Control', 'max-age=10'); // Set cache time to 10 seconds
  }
  res.send('next page content');
});
Extension:
You can also combine it with a Service Worker to control resource loading and caching strategies.
2. Preload
Purpose:preload is used to immediately load critical resources (such as fonts, CSS, JS, images, etc.) without waiting for the DOM tree to be parsed. Use preload when a resource is a critical part of the page load but cannot be obtained immediately through the normal loading sequence.
Characteristics:
- Resource loading is synchronous, ensuring that critical resources are loaded with priority. Example Code:
<link rel="preload" href="styles.css" as="style">
3. Preconnect
Purpose:preconnect establishes a network connection to an external resource server in advance, including DNS resolution, TCP handshake, and TLS negotiation. If you only need to resolve the domain name in advance, you can use dns-prefetch.
Applicable Scenarios:
- When accessing third-party resources (such as font libraries, CDN resources), to reduce the latency of requesting external resources. Example Code:
<link rel="preconnect" href="https://example.com">
<link rel="preconnect" href="https://fonts.googleapis.com">
Server-Side Dynamic Setting:
You can dynamically set preconnect on the server through response headers.
app.get('/', (req, res) => {
  res.set('Link', [
    '<https://example.com>; rel=preconnect',
    '<https://fonts.googleapis.com>; rel=preconnect'
  ]);
  res.flushHeaders(); // Send immediately
  const rs = fs.createReadStream('content');
  rs.pipe(res);
});
4. Insight: Resource Optimization in SSR Scenarios
In SSR (Server-Side Rendering) scenarios, you can first return the static part of the content (including resource loading hints), and then handle the time-consuming core HTML generation logic.
Problem Background:
If the server response is slow, the browser will wait until the entire response is complete before starting to load resources. To solve this problem, you can use Early Hints 103 or Chunked Transfer Encoding for optimization.
Example Code:
http.createServer((req, res) => {
  res.writeHead(200, {
    'Content-Type': 'text/html',
    'Transfer-Encoding': 'chunked'
  });
  // First, return the static part
  setTimeout(async () => {
    const firstScreenData = await getFirstData();
    res.write(`<link rel="preload" href="${firstScreenData.src}" as="image">`);
  }, 1000);
  // Then, return the complex calculation part
  // TODO: Handle core HTML generation logic
});
5. Early Hints 103
Purpose:Early Hints 103 is an HTTP response status code, suitable for scenarios where the server response time is long and you want to maximize the optimization of the user’s perceived loading speed.
Characteristics:
- Informs the browser in advance of the resources that need to be preloaded, before the main response.
- Reduces the loading latency of critical resources. Example Code:
app.get('/', (req, res) => {
  res.status(103).set({
    Link: [
      '</styles/main.css>; rel=preload; as=style',
      '</images/a.jpg>; rel=preload; as=image'
    ].join(',')
  }).end();
  // Then, return the actual content
  const rs = fs.createReadStream('content');
  res.set('Content-Type', 'text/html');
  rs.pipe(res);
});
ServiceWorker Cache Hit Rate Statistics [Line Chart]
Or you can directly calculate the hit rate for second visits as (pv - uv) / pv
(*)| SELECT
  date_format(__time__, '%m-%d %H:00:00') AS Time,
  COUNT(
    CASE
      WHEN p2 = 'cache_hit' THEN 1
    END
  ) * 100.0 / COUNT(*) as hit_rate,
  COUNT(*) as total_requests,
  COUNT(
    CASE
      WHEN p2 = 'cache_hit' THEN 1
    END
  ) as hit_count,
  COUNT(
    CASE
      WHEN p2 = 'cache_miss' THEN 1
    END
  ) as miss_count
FROM  "ods_aes_records"
WHERE
  p1 = 'pc_home_cache_stats'
group by
  Time
order by
  Time
Performance Percentile Statistics
((content: 'entry_f'))| WITH extracted_data AS (
  SELECT
    date_format(worker.__time__, '%m-%d %H:00:00') AS Time,
    regexp_extract(worker.content, '\[([^ ]+)', 1) AS trace,
    try_cast(
      regexp_extract(worker.content, 'entry_f (\d+)', 1) AS double
    ) AS duration_value,
    replace(gateway.rt, 'ms', '') AS RT
  FROM "b-worker-log" as worker
  LEFT JOIN "a-log" as gateway
  on regexp_extract(worker.content, '\[([^ ]+)', 1) =  gateway.trace
  where gateway.fn = 'xx'
)
SELECT
  Time,
  round(avg(duration_value), 2) as fAverage,
  round(approx_percentile(duration_value, 0.75), 2) as fP75,
  round(approx_percentile(duration_value, 0.90), 2) as fP90,
  round(approx_percentile(duration_value, 0.95), 2) as fP95,
  round(avg(try_cast(rt  as double)),2) as gAverage,
  round(approx_percentile(try_cast(rt  as double), 0.75), 2) as gP75,
  round(approx_percentile(try_cast(rt  as double), 0.90), 2) as gP90,
  round(approx_percentile(try_cast(rt  as double), 0.95), 2) as gP95
FROM extracted_data
GROUP BY Time
ORDER BY Time
Histogram for Long-Tail Distributions
WITH binned_data AS (
  SELECT
    Floor((try_cast(p5 AS double) - try_cast(p4 AS double)) / 1000 / 60) AS value
  FROM
    "xxx"
  WHERE
    try_cast(p5 AS double) IS NOT NULL
    AND try_cast(p4 AS double) IS NOT NULL
    AND (try_cast(p5 AS double) - try_cast(p4 AS double)) >= 0
),
binned_values AS (
  SELECT
    CASE
      WHEN value >= 0 AND value < 240 THEN '0-239'
      WHEN value >= 240 AND value < 480 THEN '240-479'
      WHEN value >= 480 AND value < 720 THEN '480-719'
      WHEN value >= 720 AND value < 960 THEN '720-959'
      WHEN value >= 960 AND value < 1200 THEN '960-1199'
      WHEN value >= 1200 AND value < 1440 THEN '1200-1439'
      WHEN value >= 1440 AND value < 1680 THEN '1440-1679'
      WHEN value >= 1680 AND value < 1920 THEN '1680-1919'
      WHEN value >= 1920 AND value < 2160 THEN '1920-2159'
      WHEN value >= 2160 AND value < 2400 THEN '2160-2399'
      ELSE '2400+'
    END AS bin,
    CASE
      WHEN value >= 0 AND value < 240 THEN 0
      WHEN value >= 240 AND value < 480 THEN 240
      WHEN value >= 480 AND value < 720 THEN 480
      WHEN value >= 720 AND value < 960 THEN 720
      WHEN value >= 960 AND value < 1200 THEN 960
      WHEN value >= 1200 AND value < 1440 THEN 1200
      WHEN value >= 1440 AND value < 1680 THEN 1440
      WHEN value >= 1680 AND value < 1920 THEN 1680
      WHEN value >= 1920 AND value < 2160 THEN 1920
      WHEN value >= 2160 AND value < 2400 THEN 2160
      ELSE 2400
    END AS bin_start
  FROM
    binned_data
)
SELECT
  bin,
  COUNT(*) AS num
FROM
  binned_values
GROUP BY
  bin, bin_start
ORDER BY
  bin_start;
Histogram for Even Distributions
LCP distribution:
SELECT round(try_cast(c1 AS DOUBLE)/100, 0)*100 AS val,
       count(*) AS num
WHERE try_cast(c1 AS DOUBLE) > 0
  AND try_cast(c1 AS DOUBLE) < 15000
GROUP BY val
ORDER BY val aselect round(try_cast(c1 AS DOUBLE)/100, 0)*100 AS val,
                     count(*) AS num
WHERE try_cast(c1 AS DOUBLE) > 0
  AND try_cast(c1 AS DOUBLE) < 15000
GROUP BY val
ORDER BY val
Pie Chart
SELECT
         CASE
                  WHEN try_cast(p5     as DOUBLE) > 0
                  AND      try_cast(p5 AS DOUBLE) <= 500 THEN '[0,500]'
                  WHEN try_cast(p5     AS DOUBLE) > 500
                  AND      try_cast(p5 AS DOUBLE) < 1000 THEN '[500,1000]'
                  WHEN try_cast(p5     AS DOUBLE) > 1000
                  AND      try_cast(p5 AS DOUBLE) < 2000 THEN '[1000,2000]'
                  ELSE '[2000,60000]'
         END      AS val,
         count(*) AS num
WHERE    try_cast(p5 AS DOUBLE) < 60000
AND      try_cast(p5 AS DOUBLE) > 0
GROUP BY val
ORDER BY num
How to change num to percentage:
ROUND(COUNT(*) * 100.0 / SUM(COUNT(*)) OVER(), 2) AS percentage
Filter Conditions
type: perf/pv/js-error Log type: e.g., performance/pv/error page_id: page url pid: page identifier dim1/2/3/4: Generally used to distinguish business information, e.g., whether cached p1/2/10: Specific log information
The W3C provides a wealth of performance-related resources to help developers optimize the loading speed, response time, and user experience of websites and applications.
- Performance-Related Resources
Visit the W3C Web Performance Working Group for the latest performance standards and best practices.
Additional Note: Performance optimization is a crucial part of Web development. It is recommended to follow updates to W3C performance standards, such as core metrics like LCP (Largest Contentful Paint) and CLS (Cumulative Layout Shift).
Reports
What reports are needed to analyze performance optimization. Upstream size: refers to the size of the request Downstream size: the size of the response
Backend Log Reports
End-to-end performance analysis: business identifier, data center, sample size, request body size, top-level gateway upstream/downstream size, top-level gateway RT, intermediate gateway upstream/downstream size/RT, network transmission time
Frontend Log Reports
Traffic Composition Analysis
- Traffic with
spmis internal traffic; without it, it’s not. This can be used to see the situation of internal vs. external traffic and identify the performance impact of 302 redirects.- And through
spm, know the source page of the current internal traffic.
- And through
- Use a pie chart to see the distribution of proportions.
- Use
refererto see the source of traffic.
What is Edge Caching?
Edge caching is a technology that caches content on network edge nodes close to the user. By storing data closer to the user, edge caching can significantly reduce latency and improve page loading speed.
- Core Principle: Utilizes edge nodes in a CDN (Content Delivery Network) to cache static or dynamic content, shortening the physical distance between the user and the content.
- Advantages:
- Reduces network latency, improving user experience.
- Lightens the load on the origin server, improving overall system performance.
What Problems Does It Solve?
- Inability to Utilize Cache on First Visit
In scenarios like PWAs (Progressive Web Apps), users cannot utilize client-side cache or connection reuse on their first visit, leading to slower page load speeds. - Client-Side Cache is Unavailable
When a user visits a website for the first time, the client-side cache has not yet been established, so it cannot speed up page loading. - The Challenge of Caching Dynamic Content
For scenarios with a lot of personalized content, directly caching the entire HTML is not practical. A solution is needed that can both cache and dynamically generate content.
Position of Edge Cache Nodes in the Request Chain
Edge cache nodes are typically located in the CDN (Content Delivery Network) between the user and the origin server. It acts as an intermediate layer, responsible for caching and serving static or dynamic content, thereby reducing the load on the origin server and speeding up responses.
- Workflow:
- A user initiates a request.
- The request first reaches the nearest edge node.
- If the edge node has the cached content, it is returned directly to the user; otherwise, it requests the content from the origin server and caches it.
Differences Between Edge Caching and SSR, CSR/CDN
SSR (Server-Side Rendering)
- Problem:
- Because server-side rendering requires a longer processing time, the page’s white screen time will be longer.
- Characteristics:
- All HTML content is generated by the server, which is good for SEO optimization.
- The initial load speed is slower, but it is search engine friendly.
CSR/CDN (Client-Side Rendering/Content Delivery Network)
- Problem:
- Although all HTML can be cached via a CDN, directly caching the entire HTML is not practical because each user’s page view may be different.
- Solution:
- Cache the static HTML on the CDN and use CSR (Client-Side Rendering) to request dynamic data.
- This method solves the white screen problem, but the time to meaningful content display is later than with SSR.
- Characteristics:
- Suitable for scenarios with a lot of personalized content.
- The initial loading experience is not as good as SSR, but it can flexibly support dynamic content.
ESR (Edge Server Rendering)
- Advantages:
- Parallel Processing: CSR/CDN is a serial processing method (first request HTML, then download JS and CSS resources), while ESR uses a parallel processing method: the CDN returns the cached first byte while simultaneously loading dynamic content.
- Connection Reuse: The edge server handles requests like a Service Worker, supporting connection reuse, which further reduces latency.
- Performance Improvement: Compared to a solution without ESR, page loading speed can be improved by about 200ms.
- Characteristics:
- Combines the advantages of SSR and CSR.
- It reduces white screen time and supports the fast loading of dynamic content.
Summary
| Technology | Advantages | Disadvantages | Applicable Scenarios |
|---|---|---|---|
| SSR | SEO friendly, suitable for static content | Slow initial load speed, long white screen time | Content is mainly static, requires SEO |
| CSR/CDN | Supports dynamic content, high flexibility | Short white screen time, but meaningful content displays later | Scenarios with lots of personalized content |
| ESR | Parallel processing, reduces white screen time, improves loading speed | Higher implementation complexity | Scenarios needing both performance and dynamic content |
| Edge caching (especially when combined with ESR) provides a more efficient solution for modern web applications, enabling fast loading of dynamic content while ensuring performance. It is an important direction for future web performance optimization. |
avif
As the demand for web performance optimization continues to grow, the choice of image format has become particularly important. AVIF (AV1 Image File Format) is an efficient image format that offers higher compression rates and smaller file sizes compared to JPEG and PNG. However, not all browsers support the AVIF format, so frontend compatibility detection is necessary. At the same time, on mobile devices, User-Agent (UA) detection is an important means of determining the device type. Combining UA detection with AVIF support detection can provide users with a better-optimized image loading experience.
What is the AVIF Image Format
AVIF is an image format developed by AOMedia based on the AV1 video codec, with the following features:
- High Compression Rate: Compared to JPEG, AVIF can reduce file size by about 50% at the same quality.
- High Quality: Supports transparency (Alpha channel) and HDR (High Dynamic Range).
- Growing Support Trend: Mainstream browsers (like Chrome, Firefox) are gradually starting to support AVIF.
The Role of User-Agent Detection
The User-Agent (UA) is part of the HTTP request header used to identify the client’s device, operating system, and browser information. By parsing the UA, you can:
- Determine if the user is using a mobile device (like an iPhone or Android).
- Differentiate between different browsers (like Chrome, Safari) to provide targeted optimizations.
- Dynamically adjust the image format or page layout.
How to Detect AVIF Image Support
Achieving Compatibility with the <picture> Tag
The HTML5 <picture> tag allows for dynamically loading different image formats based on browser support. For example:
<picture>
  <source srcset="image.avif" type="image/avif">
  <source srcset="image.webp" type="image/webp">
  <img src="image.jpg" alt="Fallback Image">
</picture>
- The browser will check the
typeattribute of the<source>tags in order. - If
image/avifis supported, it loads the AVIF image; otherwise, it falls back to WebP or JPEG.
Detecting AVIF Support with JavaScript
You can dynamically detect if a browser supports the AVIF format using JavaScript:
function isAvifSupported() {
  return new Promise((resolve) => {
    const avif = new Image();
    avif.src = 'data:image/avif;base64,AAAAIGZ0eXBhdmlmAAAAAGF2aWZtaWYxbWlhZk1BMUIAAADybWV0YQAAAAAAAAAoaGRscgAAAAAAAAAAcGljdAAAAAAAAAAAAAAAAGxpYmF2aWYAAAAADnBpdG0AAAAAAAEAAAAeaWxvYwAAAABEAAABAAEAAAABAAABGgAAAB0AAAAoaWluZgAAAAAAAQAAABppbmZoAAAAAAAACAAAAABubWl0AAAAAQAAAAEbmWRlcgAAAAAAAAYAAAAgbWVhcwAAAAAAAAABAAAAFGF2MDEAAAAAbG9zcwAAAAAAAAACAAAA';
    avif.onload = () => resolve(true);
    avif.onerror = () => resolve(false);
  });
}
isAvifSupported().then((supported) => {
  console.log('AVIF supported:', supported);
});
- The code above detects support by trying to load a Base64-encoded AVIF image.
- If the image loads successfully, it means the browser supports AVIF.
Notes on Mobile User-Agent Detection
Common Mobile UA Characteristics
- iOS Devices
- Example:
Mozilla/5.0 (iPhone; CPU iPhone OS 16_0 like Mac OS X) AppleWebKit/605.1.15 (KHTML, like Gecko) Version/16.0 Mobile/15E148 Safari/604.1 - Characteristic: Contains
iPhoneoriPad.
- Example:
- Android Devices
- Example:
Mozilla/5.0 (Linux; Android 12; SM-G991B) AppleWebKit/537.36 (KHTML, like Gecko) Chrome/104.0.5112.69 Mobile Safari/537.36 - Characteristic: Contains
AndroidandMobile.
- Example:
Notes
- Avoid Over-reliance on UA
The UA string can be modified or spoofed, so it should not be relied upon completely for detection. - Combine with Feature Detection
Use feature detection (likewindow.matchMediaornavigator.userAgentData) as a supplementary method. - Compatibility with Older Browsers
Some older browsers may not support modern feature detection methods, so a fallback solution is needed.
Fault Tolerance
Cases of Detection Failure
- AVIF Detection Fails
If AVIF detection fails, ensure there are other formats (like WebP or JPEG) as fallback options. - UA Detection Errors
If UA detection results are unreliable, you can further determine the device type by screen width (window.innerWidth) or touch events ('ontouchstart' in window).
Example: Comprehensive Detection and Fault Tolerance
function detectImageFormatAndDevice() {
  // Detect AVIF support
  isAvifSupported().then((avifSupported) => {
    if (avifSupported) {
      console.log('Using AVIF format');
    } else {
      console.log('Falling back to WebP or JPEG');
    }
  });
  // Detect device type
  const userAgent = navigator.userAgent || navigator.vendor || window.opera;
  if (/iPhone|iPad|iPod/.test(userAgent)) {
    console.log('Detected iOS device');
  } else if (/Android/.test(userAgent)) {
    console.log('Detected Android device');
  } else {
    console.log('Detected desktop or unknown device');
  }
}
detectImageFormatAndDevice();
h3 Protocol Upgrade
todo
Chrome User Experience Report
https://developer.chrome.com/docs/crux?hl=en Reflects how real-world Chrome users experience popular destinations on the web.
Why is transferSize smaller than encodedBodySize
In the Resource Timing API specification, encodedBodySize always reports “the size in bytes of the fetched resource’s payload body” (i.e., the original compressed size from the initial network load or from the cache), whereas transferSize reports “the size of the resource as it was actually transferred over the network,” including response headers and the payload body.
When the browser performs a revalidation of a cached resource:
The browser does not re-download the entire response body. Instead, it only sends request headers like If-Modified-Since/ETag and receives an empty or very small 304 response.
In this case, transferSize only reflects the HTTP headers included in this “validation request” (usually just a few KB) and does not count the original payload body size again.
However, encodedBodySize still uses the payload body size from “the first time it was fetched from the network or written to the cache,” which is why it is often much larger than the transferSize that only includes headers.
New articles on AI agents, full-stack engineering, and a one-person company
I email new writing about AI and agents, full-stack engineering, and building a one-person company. No spam, and you can unsubscribe anytime.